
Obesity remains a major public health challenge in the United States, affecting more than one-third of adults and contributing to a wide range of chronic conditions, including heart disease, diabetes, and certain cancers. It is strongly associated with physical inactivity, poor diet, genetics, and socioeconomic factors, and its prevalence continues to grow. Over the past decade, obesity rates have increased across every adult age group, rising by approximately five percentage points nationally.
Fortunately, in recent years, new GLP-1 weight-loss medications have shown strong results in helping individuals lose weight and manage obesity-related conditions. However, these treatments have yet to make a sizable impact at the national level, as only a relatively small share of adults with obesity are currently using them. Still, their arrival marks a promising development in the broader fight against obesity.
In light of these developments, Invigor Medical—a telehealth company focused on the wellness space—analyzed the most recent CDC data to track how obesity rates have shifted by age group over the past ten years. The analysis identifies national trends, looks at which states currently face the highest obesity rates, and highlights which age group in each state has experienced the sharpest rise in obesity since 2013.
Table of Contents
U.S. Obesity Rates by Age Group
Over the past decade, the 45–54 age group saw the largest rise in obesity
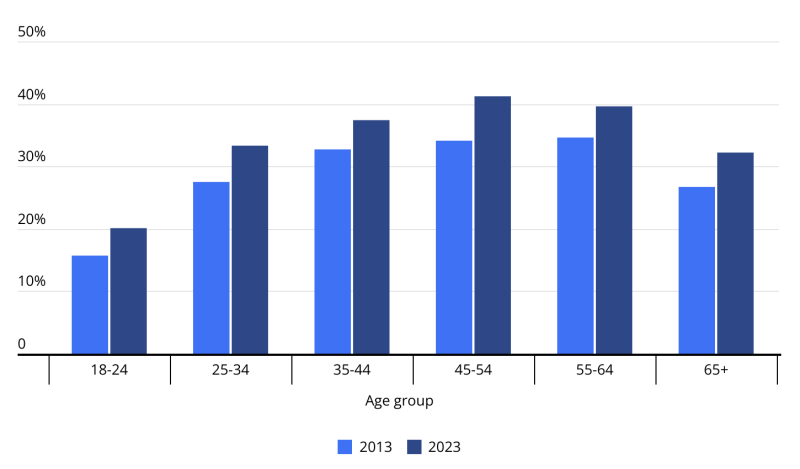
Over the past 10 years, obesity rates rose across all adult age groups in the United States. The most significant increase occurred among adults aged 45 to 54, whose obesity rate grew by 7.1 percentage points, from 34.1% to 41.2%. This group not only experienced the greatest increase but now has the highest obesity rate of any age bracket.
Adults aged 25 to 34 saw the second-fastest increase, up 5.8 percentage points to 33.3%, followed closely by adults 65 and older, whose rate rose by 5.5 percentage points. The youngest adults—those aged 18 to 24—reported the lowest obesity rates in both years but still experienced a notable rise, from 15.7% to 20.1%.
These trends highlight the extent of the challenge. While middle-aged adults remain the most affected, obesity is becoming more prevalent across all age groups.
Support your weight‑management journey with personalized Liraglutide therapy. Through telehealth guidance and doorstep delivery, you can enhance appetite control and metabolic balance. Ready to lean into a healthier future? You can buy Liraglutide injections online today.
Changes in Obesity Rates by State
While obesity is most common in the Southeast, New Mexico & Minnesota are seeing the fastest increases
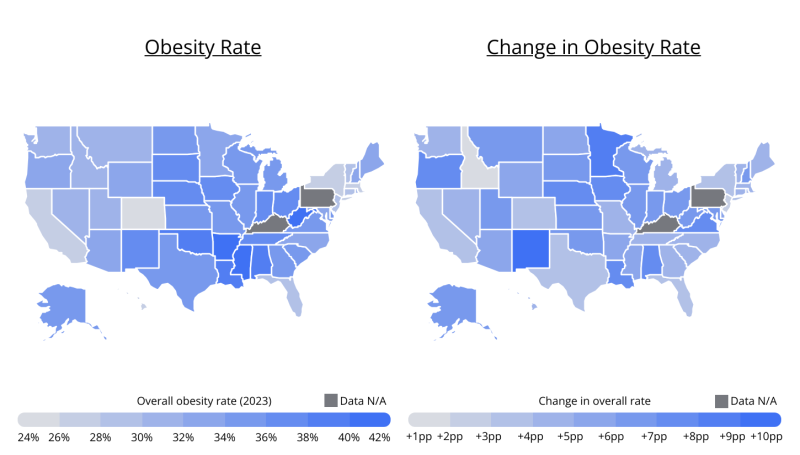
Obesity continues to be most prevalent in the Southeastern United States, a region that has long struggled with high rates of chronic health conditions. In 2023, West Virginia reported the highest adult obesity rate at 41.7%, followed by Arkansas (40.5%), Mississippi (40.4%), and Louisiana (39.9%). Alabama, Oklahoma, and Tennessee also ranked among the top 10 states with the worst obesity rates. This region has struggled with obesity for decades, reflecting entrenched challenges related to socioeconomics, healthcare access, diet, and physical activity.
However, some of the fastest increases in obesity were recorded outside the Southeast. New Mexico saw the largest rise in obesity over the last 10 years, with a 10-percentage-point increase, bringing its rate to 36.3%. Minnesota followed with an 8.1-percentage-point rise, reaching 33.0%. Other states with large increases include Alabama, Nebraska, and Oregon, each gaining 7.4 percentage points, as well as Virginia and Louisiana, which both rose by 7.3 percentage points.
Certain states are faring better. Colorado continues to report the lowest adult obesity rate in the country at 24.6%, followed by Hawaii (26.8%), Massachusetts (27.1%), and California (27.7%). Notably, states like Idaho (+1.6 pp), New Jersey (+2.8 pp), and New York (+3.1 pp) have seen relatively modest increases in obesity over the past decade, suggesting that some regions have managed to slow the rate of growth. Unfortunately, states with higher rates of obesity 10 years ago were also slightly more likely to report larger obesity rate increases, meaning that the gap between the most- and least-affected states has continued to widen over time.
Enhance your metabolism, optimize body composition, and support weight management with expertly guided Sermorelin peptide therapy. Through personalized telehealth consultation, FDA‑trusted compounding, and convenient doorstep delivery, your journey to lean muscle growth and reduced body fat is simplified. Buy Sermorelin injections for targeted support in your weight‑management plan today.
The Age Group Struggling Most With Obesity in Each State
States vary widely in which age group is gaining weight the fastest
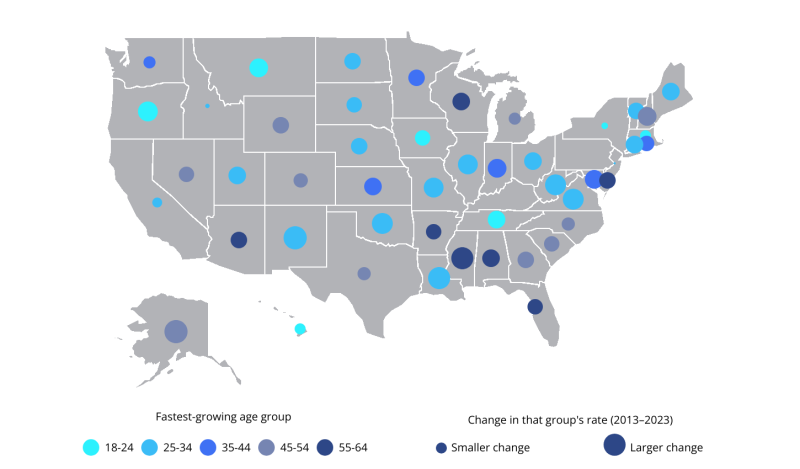
While national figures show that middle-aged adults struggle most with obesity, state-level data reveal a more complex picture. In many states, the most rapid increases are now occurring among younger adults—suggesting that the epidemic may be gaining momentum earlier in adulthood than in previous decades.
In 18 states, adults aged 25 to 34 experienced the largest increase in obesity over the past 10 years, making this the most commonly affected age group nationwide. Some of the most striking cases include New Mexico (+13.6 percentage points), Louisiana (+13.2 pp), and Virginia (+12.4 pp), each reporting double-digit increases in this cohort. Other states with similarly steep gains among 25- to 34-year-olds include West Virginia, Oklahoma, Illinois, and Missouri.
In seven states, the fastest-growing obesity rates were among the youngest adults—those aged 18 to 24. These include Oregon (+11.3 pp), Montana (+10.9 pp), and Tennessee (+9.7 pp). Taken together, these two youngest age groups saw the largest increases in half of all states.
In the remaining states, the largest increases were concentrated among older adults, particularly in the 35–64 range. Notable examples include a 14.1-percentage-point rise among 45- to 54-year-olds in Alaska, a 12.7-point rise among 55- to 64-year-olds in Mississippi, and a 10.8-point rise for 45- to 54-year-olds in New Hampshire.
This variation underscores the need for tailored, state-specific responses to the obesity epidemic. While some states may benefit from earlier intervention strategies focused on younger adults, others may need to prioritize middle-age populations where rates continue to rise.
The tables below provide a detailed breakdown of obesity trends by state and age group, including which demographic segments have seen the sharpest increases over the past decade. For details on data sources and analytical methods, see the methodology section.
Full Results
Methodology
This analysis uses data from the CDC’s Behavioral Risk Factor Surveillance System (BRFSS) to examine changes in adult obesity rates across U.S. states from 2013 to 2023. Only states with complete data for both years were included. Washington, D.C., U.S. territories, and states with missing data were excluded.
For each state, Invigor Medical calculated the age-adjusted obesity rate in 2013 and 2023, as well as the percentage point change over that period. The team also examined crude obesity rates by age group to identify which group in each state saw the largest increase in obesity prevalence over the decade. The CDC defines obesity as having a body mass index (BMI) of 30 or higher, based on self-reported height and weight.
Because BRFSS does not provide nationally weighted estimates by age, the median of state-level values was used to report national-level figures.